
Introduction: The Unexpected Assignment
Rajesh Mehta, owner of Mehta Gifts & Stationery, had successfully transitioned his growing business to Microsoft Dynamics 365 Business Central with the help of Rohan, a talented AL developer. What started as a small local shop with manual notebooks had transformed into a thriving operation managing 500 customers and 200 products digitally.
One morning, Rajesh walked into Rohan’s workspace with a stack of printed reports from their new Business Central system.
“Rohan, these system-generated reports look… unprofessional. Our customers are used to the personalized touch we gave them before. Can you make these look like they came from Mehta Gifts & Stationery? You know—add our logo, match our brand colors, customize the columns for our gift items, maybe even set up automated email delivery for order confirmations?”
Rohan nodded confidently, but inside, his mind was racing. “Reports? Layouts? RDLC? Word? What’s the difference?” Where do I even start?
That evening, Rohan opened his laptop in the back office of Mehta Gifts & Stationery and began what would become a three-week deep dive into the world of Business Central Report Layouts. This is his story—and his complete technical guide.
Chapter 1: Understanding the Foundation: The Two Parts of Every Report
Rohan’s first discovery was fundamental: every Business Central report consists of two distinct parts:
1. Dataset (AL Code) – The “What”
- Defines which data to fetch from the database
- Written in AL programming language
- Contains data items, columns, filters, and calculations
- Lives in your AL extension code
2. Layout (RDLC/Word/Excel/HTML) – The “How”
- Defines how the data should be presented visually
- Can be created in various tools (Visual Studio, Word, Excel)
- Controls fonts, colors, logos, formatting, page breaks
- Can be customized per user or per company
Rohan sketched a simple diagram on a notepad at the Mehta store counter, showing Rajesh how customer data flows from Business Central tables through the dataset into beautifully formatted invoices.
Chapter 2: The Five Layout Types Explained
Rohan spent his first week researching each layout type while helping customers at the shop during the day. He created this comparison table:
| Layout Type | Editor Tool | Best For | Skill Level | File Extension |
| RDLC | Visual Studio Report Builder | Official forms, invoices, checks, pixel-perfect designs | Advanced | .rdl / .rdlc |
| Word | Microsoft Word | Business letters, simple documents, user-editable reports | Beginner | .docx |
| Excel | Microsoft Excel | Financial analysis, pivot tables, data manipulation | Intermediate | .xlsx |
| Custom Layout | Any of the above | Company-specific branding, per-user templates | Varies | Various |
| HTML (Preview) | Code editor / Browser | Web-based reports, responsive designs, interactive dashboards | Advanced | .html |
When to Use Each Layout Type
RDLC Layout – The Professional Choice
- Fixed, pixel-perfect positioning
- Complex calculations and expressions
- Multi-page documents with precise page breaks
- Government forms requiring exact formatting
Example: Tax forms, official invoices, bank checks
Word Layout – The User-Friendly Choice
- Non-technical users can modify
- Easy to add company logos and branding
- Simple table structures
- Quick prototyping
Example: Business letters, simple reports, contracts
Excel Layout – The Analytical Choice
- Users can apply formulas and pivot tables
- Direct export to Excel with formatting preserved
- Financial reporting and analysis
- Interactive data manipulation
Example: Budget reports, sales analysis, financial statements
HTML Layout – The Modern Choice
- Responsive design for different screen sizes
- Interactive elements (collapsible sections, clickable links)
- Cloud-first organizations
- Modern look and feel
Example: Web dashboards, online catalogs, interactive reports
Chapter 3: Building Your First RDLC Report – Step by Step
The Business Requirement
Rohan’s first task was to create a custom Sales Invoice report for Mehta Gifts & Stationery that included:
- Company logo and branding with the distinctive orange and green colors
- Customer details
- Line items with gift descriptions and amounts
- Subtotals and grand total
- Professional formatting suitable for a gifts business
Step 3.1: Creating the Dataset in AL
Rohan opened Visual Studio Code and created a new report file:
AL

report 50550 "Mehta Sales Invoice"
{
Caption = 'Mehta Gifts Sales Invoice';
UsageCategory = ReportsAndAnalysis;
ApplicationArea = All;
DefaultLayout = RDLC;
RDLCLayout = './Layouts/MehtaSalesInvoice.rdl';
dataset
{
    dataitem(SalesHeader; "Sales Header")
    {
        DataItemTableView = SORTING("No.")
                            WHERE("Document Type" = CONST(Order));

        column(DocumentNo; "No.") { }
        column(SellToCustomerName; "Sell-to Customer Name") { }
        column(SellToAddress; "Sell-to Address") { }
        column(SellToCity; "Sell-to City") { }
        column(PostCode; "Sell-to Post Code") { }
        column(OrderDate; "Order Date") { }
        column(CurrencyCode; "Currency Code") { }

        dataitem(SalesLine; "Sales Line")
        {
            DataItemLink = "Document Type" = FIELD("Document Type"),
                           "Document No." = FIELD("No.");
            DataItemLinkReference = SalesHeader;

            column(LineNo; "Line No.") { }
            column(ItemNo; "No.") { }
            column(Description; Description) { }
            column(Quantity; Quantity) { }
            column(UnitPrice; "Unit Price") { }
            column(LineAmount; Amount) { }
        }

        dataitem(CompanyInfo; "Company Information")
        {
            DataItemTableView = SORTING("Primary Key");

            column(CompanyName; Name) { }
            column(CompanyAddress; Address) { }
            column(CompanyCity; City) { }
            column(CompanyPostCode; "Post Code") { }
            column(CompanyPhoneNo; "Phone No.") { }
            column(CompanyEmail; "E-Mail") { }
        }
    }
}

requestpage
{
    layout
    {
        area(content)
        {
            group(Options)
            {
                Caption = 'Options';
                field(ShowAmounts; ShowAmounts)
                {
                    ApplicationArea = All;
                    Caption = 'Show Amounts';
                    ToolTip = 'Specifies if amounts should be displayed';
                }
            }
        }
    }
}

var
    ShowAmounts: Boolean;
}
Step 3.2: Designing the RDLC Layout
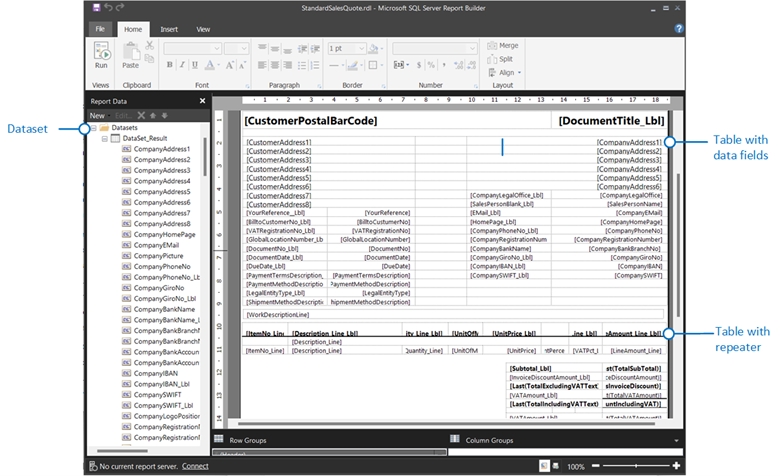
Rohan downloaded Microsoft Report Builder and followed these steps:
1. Generate the initial layout
- In VS Code, right-click the report file
- Select “Create Initial Layout”
- This generates a basic .rdl file with all dataset columns
2. Open in Report Builder
- Open the generated .rdl file in Report Builder
- The Report Data pane shows all available columns
3. Design the invoice
- Added Mehta Gifts & Stationery logo as an image
- Created header section with company information in brand colors
- Designed customer details section
- Added a table (Tablix) for line items
- Created footer with totals
4. Add expressions and calculations
= Sum(Fields!LineAmount.Value) // For subtotal = Fields!CompanyName.Value // For company name5. Format and style
- Set fonts (Arial, 10pt for body, 14pt for headers)
- Added borders and shading to tables matching the store’s branding
- Set page margins and orientation
6. Save and test
- Saved the .rdl file back to the project
- Compiled and deployed the extension – Ran the report to test
The Result
When Rohan showed the report to Rajesh, his face lit up:
“Rohan, this is exactly what I imagined! It looks like it came from a professional printing company! The logo is perfect, the colors match our store, and it even calculates the totals correctly! Our customers will love receiving these!”
Rohan smiled—his first RDLC success for Mehta Gifts & Stationery.
Chapter 4: Word Layouts – Empowering End Users
The New Requirement
A week later, Priya from the accounting team approached Rohan:
“Rohan, this invoice looks great, but every time we need to change the logo for seasonal promotions or add a new field for gift wrapping options, we have to ask you. Can you make it so we can edit it ourselves in Word? Rajesh sir keeps asking us to update these things quickly.”
Rohan realized this was the perfect use case for Word Layouts.
Step 4.1: Creating a Word Layout
AL
report 50551 "Mehta Editable Invoice"
{
Caption = 'Mehta Gifts Editable Invoice';
UsageCategory = ReportsAndAnalysis;
ApplicationArea = All;
DefaultLayout = Word;
WordLayout = './Layouts/MehtaSalesInvoiceWord.docx';
dataset
{
    dataitem(SalesHeader; "Sales Header")
    {
        column(DocumentNo; "No.") { }
        column(CustomerName; "Sell-to Customer Name") { }
        column(OrderDate; "Order Date") { }

        dataitem(SalesLine; "Sales Line")
        {
            DataItemLink = "Document Type" = FIELD("Document Type"),
                           "Document No." = FIELD("No.");

            column(ItemNo; "No.") { }
            column(Description; Description) { }
            column(Quantity; Quantity) { }
            column(Amount; Amount) { }
        }
    }
}
}
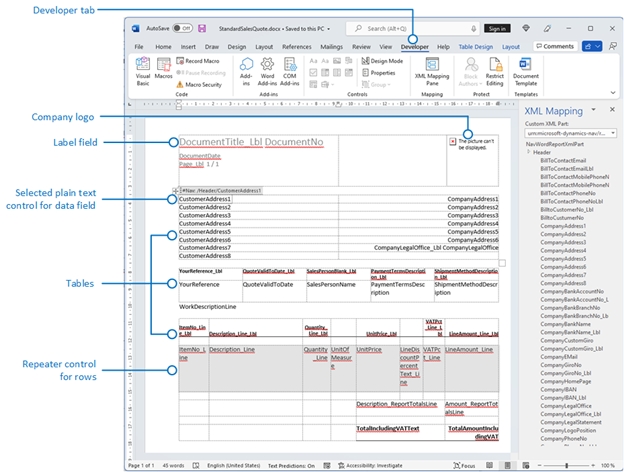
Step 4.2: Designing in Microsoft Word
Rohan followed these steps:
1. Export the Word template
- In Business Central, go to Report Layouts
- Find report 50551
- Click “Export Layout”
- Save the .docx file
2. Open in Word and enable Developer tab
- File → Options → Customize Ribbon
- Check “Developer” tab
3. Insert merge fields
- In Word, click Developer → Insert Merge Field
- Select fields like
<<DocumentNo>>,<<CustomerName>>
4. Create a repeating table for line items
<>
Item: <>
Description: <>
Quantity: <>
Amount: <>
<>
5. Add company logo and formatting
- Insert → Pictures → Select Mehta Gifts & Stationery logo
- Apply fonts, colors (orange and green brand colors), and styles
- Add borders and shading
6. Save and upload
- Save the .docx file
- In Business Central, go to Report Layouts
- Click “Import Layout” and upload your file
The Result
“Perfect! Now anyone in our team can update the logo for Diwali promotions or change colors for special occasions without coding!” exclaimed Priya, clearly relieved.
Rohan learned a valuable lesson: Sometimes the best solution is the one that empowers users like the Mehta team, not impresses developers.
Chapter 5: Excel Layouts – For the Data Analysts
Rajesh’s Request
During a monthly review meeting at the store, Rajesh said:
“Rohan, these PDF reports are nice, but I spend hours re-typing data into Excel to analyze which gift categories sell best during festivals. Can you give us reports that are already in Excel format with formulas pre-built so I can quickly see trends?”
Rohan discovered Excel Layouts—a feature that would be perfect for Rajesh’s analytical needs.
Step 5.1: Creating an Excel Layout
AL
report 50552 "Mehta Sales Analysis"
{
Caption = 'Mehta Gifts Sales Analysis';
UsageCategory = ReportsAndAnalysis;
ApplicationArea = All;
DefaultLayout = Excel;
ExcelLayout = './Layouts/MehtaSalesAnalysis.xlsx';
dataset
{
    dataitem(SalesHeader; "Sales Header")
    {
        column(DocumentNo; "No.") { }
        column(CustomerNo; "Sell-to Customer No.") { }
        column(CustomerName; "Sell-to Customer Name") { }
        column(OrderDate; "Order Date") { }
        column(TotalAmount; "Amount Including VAT") { }
        column(Status; Status) { }
    }
}
}
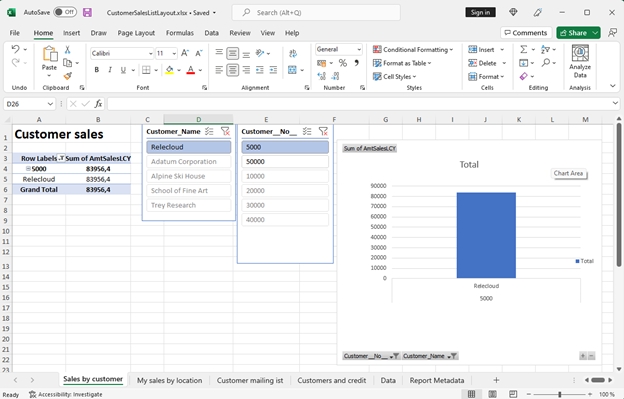
Step 5.2: Designing the Excel Template
Rohan created a sophisticated Excel template tailored for Mehta’s gift business:
1. Export dataset to Excel
- Run the report with default layout
- Export to Excel to see available columns
2. Create named ranges
- In Excel, select the data range
- Formulas → Define Name
- Name it SalesHeader_DocumentNo, SalesHeader_TotalAmount, etc.
3. Add formulas
excel
=SUM(SalesHeader_TotalAmount) // Grand total
=AVERAGE(SalesHeader_TotalAmount) // Average order
=COUNTIF(SalesHeader_Status,"Open") // Count open orders
4. Create charts and pivot tables
- Insert → PivotTable
- Design charts showing gift category trends
- Format professionally with Mehta branding
5. Upload to Business Central
- Save the .xlsx file
- Import as Excel Layout in Report Layouts
The Result
“This is incredible! Now I can run the report and immediately see which gifts are trending for wedding season versus festival season. You’ve saved me 10 hours per week!” praised Rajesh enthusiastically.
Chapter 6: Processing-Only Reports – Behind the Scenes
The Automation Challenge
Rajesh had a new requirement:
“Rohan, we’ve partnered with a local delivery service. They need a nightly export of all pending deliveries in CSV format. No printing needed, just the data file sent automatically.”
This is where Processing-Only Reports shine.
Step 6: Creating a Processing-Only Report
AL
report 50553 "Mehta Export Deliveries"
{
Caption = 'Export Pending Deliveries to CSV';
ProcessingOnly = true;
UsageCategory = ReportsAndAnalysis;
ApplicationArea = All;
dataset
{
    dataitem(SalesHeader; "Sales Header")
    {
        DataItemTableView = SORTING("No.")
                            WHERE("Document Type" = CONST(Order));

        trigger OnAfterGetRecord()
        begin
            ExportLine();
        end;
    }
}

requestpage
{
    layout
    {
        area(content)
        {
            group(Options)
            {
                field(FilePath; FilePath)
                {
                    ApplicationArea = All;
                    Caption = 'Export File Path';
                }
            }
        }
    }
}

trigger OnPreReport()
begin
    TempBlob.CreateOutStream(OutStreamObj);
    OutStreamObj.WriteText('OrderNo,CustomerName,OrderDate,Amount' + LineBreak);
end;

trigger OnPostReport()
var
    FileManagement: Codeunit "File Management";
    InStreamObj: InStream;
    FileName: Text;
begin
    TempBlob.CreateInStream(InStreamObj);
    FileName := 'MehtaDeliveries_' + Format(Today, 0, '<Year4><Month,2><Day,2>') + '.csv';
    DownloadFromStream(InStreamObj, 'Export File', '', 'CSV Files (*.csv)|*.csv', FileName);
end;

local procedure ExportLine()
var
    LineText: Text;
begin
    LineText := SalesHeader."No." + ',' +
                SalesHeader."Sell-to Customer Name" + ',' +
                Format(SalesHeader."Order Date") + ',' +
                Format(SalesHeader."Amount Including VAT");

    OutStreamObj.WriteText(LineText + LineBreak);
end;

var
    TempBlob: Codeunit "Temp Blob";
    OutStreamObj: OutStream;
    FilePath: Text;
    LineBreak: Char;
}
Key Features of Processing-Only Reports
- No layout required – Saves development time
- Perfect for automation – Can be scheduled with Job Queue
- File exports – CSV, XML, JSON, TXT
- Data synchronization – Push data to external systems
- Background processing – No UI interaction needed
Chapter 7: Advanced Techniques
Step 7: Automating Report Email Delivery
Rohan created a reusable procedure for emailing order confirmations to Mehta’s customers:
    AL
codeunit 50100 "Mehta Report Email Automation"
{
procedure RunReportAndEmailPdf(
ReportId: Integer;
RecRef: RecordRef;
ToEmail: Text;
Subject: Text;
Body: Text)
var
TempBlob: Codeunit "Temp Blob";
EmailMessage: Codeunit "Email Message";
Email: Codeunit Email;
InStreamObj: InStream;
OutStreamObj: OutStream;
FileName: Text;
begin
// Generate PDF
TempBlob.CreateOutStream(OutStreamObj);
Report.SaveAs(ReportId, '', ReportFormat::Pdf, OutStreamObj, RecRef);
// Prepare for email
    TempBlob.CreateInStream(InStreamObj);
    FileName := 'MehtaGifts_' + Format(ReportId) + '_' + Format(CurrentDateTime, 0, '<Year4><Month,2><Day,2>') + '.pdf';

    // Create and send email
    EmailMessage.Create(ToEmail, Subject, Body, false);
    EmailMessage.AddAttachment(FileName, 'application/pdf', InStreamObj);
    Email.Send(EmailMessage, Enum::"Email Scenario"::Default);

    Message('Report emailed successfully to %1', ToEmail);
end;
}
Appendix: Complete Code Examples & Resources
Quick Decision Tree
Need to create a report?
├─ Users edit frequently? → Word Layout
├─ Formal document? → RDLC Layout
├─ Data analysis? → Excel Layout
├─ Web/Interactive? → HTML Layout
└─ No visual output? → Processing-Only
```
Performance Tips
- Use DataItemLink instead of Get() calls
- Filter early with DataItemTableView
- Only include necessary columns
- Test with large datasets
Testing Checklist
- Empty dataset
- Single record
- Large dataset (500+ records)
- Special characters
- Multi-language content
- Email delivery
- Print quality
Reports aren’t just technical components—they’re how your business communicates with the world.